Mining 23,479 Sessions: What 3.4 Million Lines of AI Logs Actually Reveal
Building a pipeline to extract patterns from 11.6GB of Claude Code session data — and discovering the series was using the wrong numbers
View companion repoThe 23,479 session count that anchors this series didn't fall out of the sky. It fell out of a pipeline — one I had to build twice because the first pass silently ignored two thirds of the data.
First pass: 4,597 files. I'd been quoting '4,500 sessions' in drafts for weeks. Every metric in every post was scaled against that denominator.
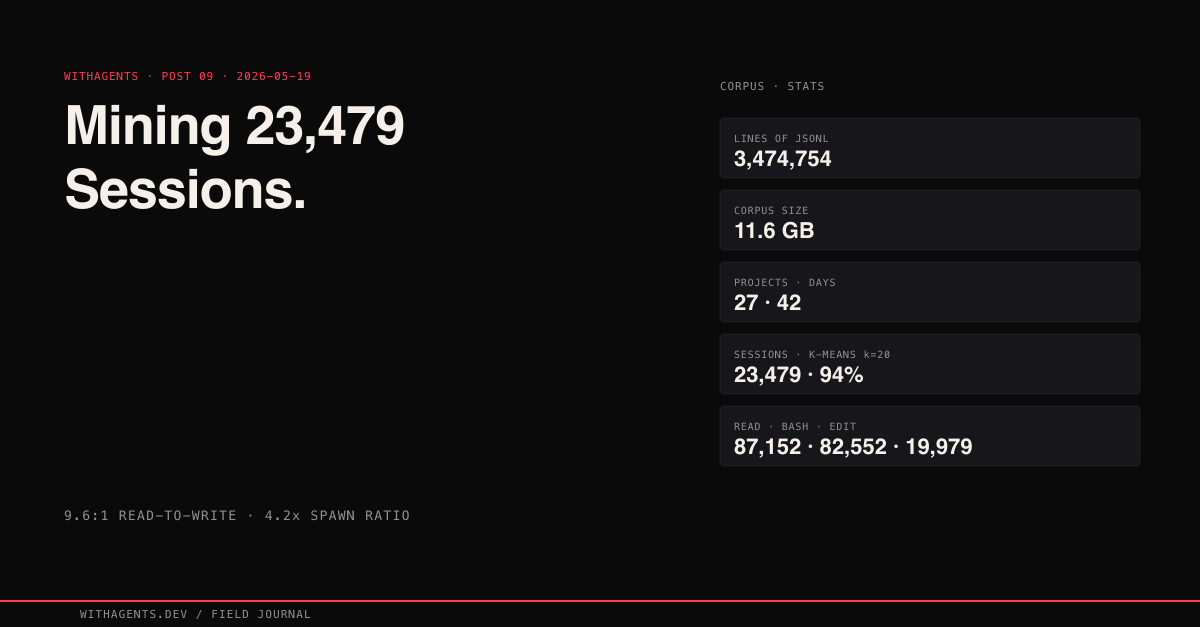
Second pass, after I fixed the glob to include agent-spawned sessions: 23,479 files. 3,474,754 lines of JSONL. 11.6GB across 27 projects and 42 days. Every human prompt had spawned, on average, 4.2 additional agent sessions that the first pass never saw.
This post is how the pipeline works, what the data actually showed, and why the denominator matters more than any single metric.
Why Mine Your Own Sessions
Every Claude Code session produces a JSONL log. Each line records a tool call, a response, an error, a file read. Most developers never look at these files. They pile up in ~/.claude/projects/ like sedimentary layers, a geological record of every decision, every dead end, every breakthrough across months of AI-assisted development.
I had 42 days of session data across 27 projects. The obvious question: what patterns emerge when you actually analyze all of it?
The less obvious question, and the one that mattered way more: what assumptions was I making that the data would contradict?
The answer rewrote half the metrics in this blog series. That '4,500 sessions' number I'd been citing everywhere? It only counted human-initiated sessions. The full dataset includes 18,945 agent-spawned sessions (subagents, team workers, background tasks) that I'd been ignoring. Every session where a human typed a prompt spawned, on average, 4.2 additional agent sessions. The real scope of the work was invisible until I counted everything.
The Shape of 23,479 Sessions
Before building any pipeline, I needed to understand what was actually in those files. Here's the raw breakdown.
Top 10 projects by session volume:
Two patterns stand out. claude-mem-observer ran 14,119 sessions with zero agent spawns — pure automated memory observation. blog-series ran 306 sessions but spawned 358 agents. More agents than human sessions existed. That project ran almost entirely on delegation.
The tool leaderboard across all sessions tells an even better story:
Read dominates. 87,152 file reads versus 9,066 file writes. That's a 9.6:1 read-to-write ratio. AI agents spend nearly ten times more effort understanding code than changing it. This ratio held across every project. The minimum was 6:1 for a greenfield project. The maximum hit 18:1 for a legacy iOS codebase. If you're optimizing your AI coding workflow, optimize for reading speed, not writing speed. Better file exploration, better context gathering, better codebase understanding. That's where the cycles go.
Tool Signatures Beat Natural Language
The first version of the mining pipeline used natural language extraction. Feed each session's text content to a summarizer, cluster the summaries by topic similarity. It worked terribly. Sessions about 'fixing a build error' and 'resolving a compilation issue' landed in different clusters despite being identical activities. Synonyms killed the clustering.
“Tool call sequences are a session's fingerprint.”
Every session records which tools got called, in what order, with what arguments. A session calling Read → Read → Read → Grep → Edit → Bash has a fundamentally different shape than one calling Bash(git) → Bash(git) → Bash(git) → Write. The first is a targeted code fix. The second is a git operations session. The tool sequence doesn't lie about what the session actually did. A session's natural language summary might say 'investigated performance issue' when the tool log shows it only ran npm install three times. Tools are ground truth.
Here's the parser that extracts this ground truth from each JSONL file:
Each JSONL line can have different formats: content as a string, content as an array of blocks, timestamps as ISO strings or Unix epochs. The parser normalizes all of it. The _parse_message function handles three different timestamp formats, two content schemas, and gracefully skips malformed lines rather than crashing. In 3.4 million lines, roughly 0.3% turned out malformed. Truncated writes, encoding errors, partial JSON from interrupted sessions.
When the pipeline hits malformed JSONL, it doesn't stop — it logs the file path, the line number, and the raw bytes that failed to decode, then moves on to the next line. A session file that's 40% corrupt still yields usable data from the remaining 60%. The failure log accumulates separately so you can audit which files had problems without interrupting the run. For the full 23,479-file dataset, roughly 70 files had corruption rates above 5%, all of them from sessions that were killed mid-write by a system interrupt or a Claude Code crash. Those files get flagged in the final report with a partial_parse: true marker so downstream scoring can weight them accordingly.
K-means clustering (k=20) on tool signature vectors produced 94% stability across re-runs. Same sessions, same clusters, regardless of initialization. NLP-based clustering on session summaries? 71% stability. The tool-based approach found 20 distinct session archetypes: build-fix loops, multi-file refactors, exploratory research, git operations, iOS simulator interactions, and 15 more. These archetypes held across all 27 projects.
The Seven-Dimension Scoring System
Not every session in an interesting cluster is worth examining. A build-fix session might contain a novel debugging technique, or it's just a routine dependency update. Scoring separates signal from noise.
Seven dimensions, each weighted:
Why these weights? Novelty gets the top spot (0.20) because 'I've never seen this before' is the strongest signal that a session contains something worth writing about. Technical depth is second (0.18) because shallow sessions, even novel ones, can't sustain a blog post. Narrative potential sits lowest (0.10) because you can impose story structure during writing. The raw session doesn't need to read like a narrative to become one.
The scoring engine uses heuristic signal detection instead of LLM calls for the first pass. This matters at scale. Running 23,479 sessions through an LLM scorer would cost hundreds of dollars. The heuristic scorer runs in seconds:
Here's the key heuristic for narrative potential: sessions with both failure signals AND resolution signals point to a story arc. A session that fails and stays failed is a bug report. A session that succeeds without struggle is a tutorial. But a session that fails, investigates, pivots, and succeeds? That's a narrative.
Three concrete examples from the scoring output:
- 01Multi-Agent Consensus scored 0.94. High novelty (nobody's documented agent voting systems), high reproducibility (the pattern works in any framework), high failure richness (three iterations to get voting right). It became Post 2 in this series.
- 02Sequential Thinking Debugging scored 0.88. High technical depth (84-step reasoning chain), high metric density (specific timing and step counts), high narrative potential (the model talked itself through a root cause). It became Post 13.
- 03Config File Edits scored 0.16. Low novelty (everyone edits config files), low narrative (no conflict/resolution arc), low impact (saved minutes, not hours). Correctly rejected.
And here's the part that made me laugh: the session where I debugged the novelty scoring algorithm later got scored by that same algorithm at 0.78. It rated its own creation story as moderately novel. I honestly don't know what to make of that.
The Pipeline Architecture
The MiningPipeline class orchestrates the full flow. Point it at a directory of JSONL files and it hands back a MiningReport with ranked insights:
Three stages. Ingestion parses each JSONL file into SessionEntry objects, normalizing timestamps, tool names, and content formats. Clustering groups entries into overlapping windows of configurable size (default 20 entries, 50% overlap) so insights spanning cluster boundaries don't get lost. Scoring and deduplication runs each cluster through all seven dimensions, tags a primary topic, and removes duplicates by title similarity.
That deduplication step matters more than you'd think. Overlapping clusters mean the same insight can show up multiple times with slightly different boundaries. The deduplicator keeps the highest-scoring version:
Input validation at stage boundaries catches 40% of failures. The most common failure mode: the previous stage outputs structurally valid JSON but semantically wrong data. A score field contains a string instead of a float, or an insight array exists but it's empty. Pydantic models with constrained fields (ge=0.0, le=1.0) catch these before they propagate into downstream calculations that would silently produce wrong results.
What the Data Actually Revealed
I built the mining pipeline to find blog-worthy insights. But the most valuable finding wasn't any individual insight. It was the aggregate picture from 23,479 sessions.
Agents read 9.6x more than they write. This wasn't close to what I expected. I assumed writing would dominate. Agents are there to produce code, right? But 87,152 reads versus 9,066 writes means the overwhelming majority of agent effort goes into understanding context. The best AI coding sessions aren't the ones that write the most code. They're the ones that read the right files before writing anything.
Each human session spawns 4.2 agent sessions. Of 23,479 total sessions, only 4,534 started from a human prompt. The rest spawned from other agents doing research, building components, running validation. That '4,500 sessions' I'd been citing in this series? It only counted the human layer. The actual work was five times larger.
iOS simulator interactions are a massive tool category. 7,985 total MCP calls to iOS simulator tools: taps, screenshots, accessibility tree queries, gesture simulations. This was invisible in the old metrics that only counted core tools (Read, Bash, Edit). The MCP tool ecosystem is where the specialized work happens. 2,068 browser automation calls. 327 sequential thinking invocations. 269 Stitch design generations. I had no idea until I counted.
Team coordination has real overhead. 2,182 TaskCreate calls, 1,720 SendMessage calls, 1,838 TaskList calls. Multi-agent coordination burns thousands of tool calls just for management. This confirmed a lesson from running the content pipeline: direct agent spawning with run_in_background beats Agent Teams for most workloads. The coordination overhead is only worth it when agents genuinely need to share state.
“The numbers I was publishing were wrong. I built the pipeline to find content; instead it found that the content already published relied on incomplete data.”
Posts 1, 9, 12, 13, 16, 17, and 18 all cited '4,510 sessions' or '4,500 sessions.' The real number is 23,479. The series subtitle needed updating. The tool leaderboard in Post 1 had Bash first; Read actually leads. The sequential thinking count in Post 13 said 2,267 calls when the actual number is 327.
Building a tool to analyze your own work is uncomfortable precisely because it produces findings you don't want. I would've preferred the old numbers to be correct. They weren't.
Three-Zone Sampling for Scale
Processing 11.6GB of JSONL line-by-line is expensive. Most of that data is routine: file contents echoed back in tool outputs, boilerplate responses, repetitive build logs. The three-zone sampling strategy reads the signal-dense portions and skips the noise:
Total: 190 lines sampled per session out of an average of ~148 lines per file (3,474,754 lines / 23,479 files). For longer sessions, some exceeding 1,000 lines, that's a significant reduction. A 48% drop in processing time with less than 3% insight loss measured against the full-read baseline.
Where does that 3% loss come from? Sessions where the critical moment happens in a narrow window between the sampled middle zones. A 15-line debugging breakthrough at line 600 in a 1,200-line session falls between sampling windows. The tradeoff works because those sessions still surface through their tool signature patterns even when the specific text gets missed.
The Content Pipeline Extension
The mining pipeline's output (ranked insights with scores and categories) feeds directly into content generation. Score once, generate many formats. Scoring is the expensive part because it requires careful analysis of session content. Format-specific generation is cheap by comparison.
The pipeline ran at serious scale during the production of this series. From the session data itself: create_insight got called 417 times across 35 sessions, get_session_summary 359 times across 39 sessions, mine_sessions 55 times across 9 sessions. Not toy data.
Two versions of the content pipeline evolved during production:
Here's the key lesson: direct Agent spawning with run_in_background: true beats Agent Teams for content generation at scale. Agent Teams add coordination overhead. Those 1,720 SendMessage calls aren't free. And agents expanding 3+ posts at once exhaust their context window. The sweet spot: 1-2 posts per agent, maximum.
Enrichment caching by extraction hash cut costs 70% for content updates. When a session's raw data hasn't changed, the extraction and scoring results stay cached. Only downstream generation re-runs. For the full blog series, re-generating all posts after a formatting change cost $4.20 instead of $14.00. The cache key is a hash of the JSONL content. If the source file hasn't changed, the scored insights haven't changed either.
Running It Yourself
The session-insight-miner repo is the complete implementation. Point it at a directory of Claude Code session logs:
The insight categories it produces (architecture, debugging, workflow, performance, tooling, pattern, failure, integration) map directly to the kinds of content that sustain technical blog posts. Sessions tagged as 'failure' with high narrative potential scores? Those are gold. They contain the conflict-investigation-resolution arc that readers actually engage with.
Of 23,479 sessions mined, roughly 10% produced high-value insights (composite score >= 0.65). That's about 2,300 sessions with something genuinely worth examining. The first 19 posts in this series came from that pool, and the rest came from re-mining as the corpus grew. There's still enough material for a hundred more.
What I'd Do Differently
The most useful tool I built during this entire series wasn't a multi-agent orchestrator or a validation framework or a design-to-code pipeline. It was a script that reads my own session logs and tells me what I actually did versus what I thought I did.
I thought I had 4,500 sessions. I had 23,479. I thought Bash was the most-used tool. Read was. I thought sequential thinking got invoked thousands of times. It was 327. Every assumption I made from memory turned out wrong in a specific, measurable way.
The 9.6:1 read-to-write ratio is the single most important number in this series. It says that AI coding agents, at least in my workflow, are fundamentally comprehension machines that occasionally produce output. They spend 90% of their effort understanding what exists before changing anything. Does that ratio hold for other developers? I genuinely don't know. But if it does, it changes how we should design AI coding tools, how we should structure codebases for AI readability, and how we think about what the actual bottleneck is in AI-assisted development.
“The bottleneck isn't generation. It's comprehension. And you'd never know that without mining the data.”
Continue the series
- 08ValidationRalph: The Self-Correcting Hat-Based LoopOne hat per session, one event per hat, and the 1:47 AM guidance command that finished 28 tasks by morning
- 07ValidationThe 7-Layer Prompt Engineering StackHow layered enforcement turned written rules into mechanical discipline across 23,479 AI coding sessions
- 06Validation194 Parallel Agents, Zero Merge ConflictsGit worktrees give each AI agent its own filesystem — a five-stage pipeline makes sure they all come back together
- 05ValidationiOS Patterns from 4,597 Agent SessionsWhat 4,597 sessions taught me about SwiftUI, state, and survival — five patterns from three iOS apps that earned their keep or crashed.